Of Charts
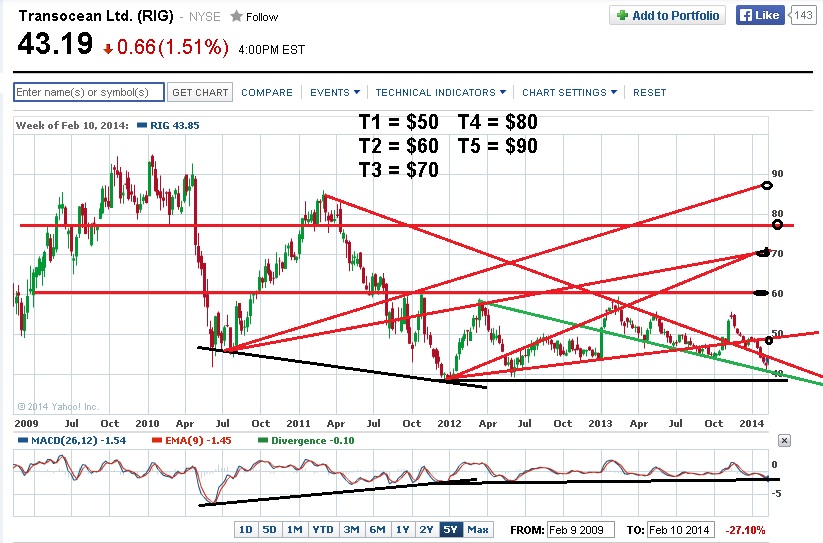
A 5-year - chart of RIG shows It could come back $40 to create a second bullish divergent. We have some its targets if it breakouts.
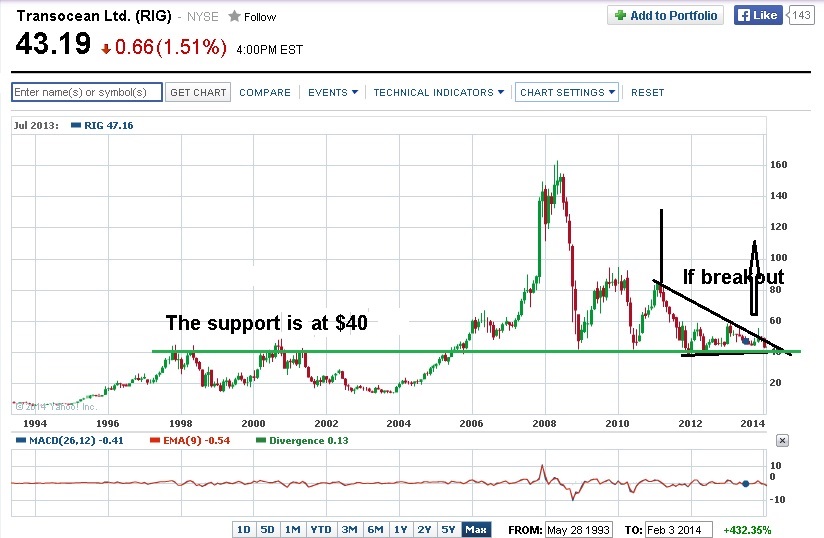
A larger chart shows it has a stong at support $40. If it breakuot, its long-term target price is at around $130
Of fundamentals
Levered Free Cash Flow (ttm): 27.88M : (Npte: Too small with a multi-billion company)
Return on Assets (ttm): 3.20%: (Note: More than 9% is better)
(Data got from page finance.yahoo.com)
Read More...
Select Category
February 6th, 2014
4:42 pm
Dow, S&P's prediction early Feb-6-2014 (see privious) are done.
Please, see pictures of Dow and S&P 500
Read More...
Please, see pictures of Dow and S&P 500
Read More...
February 6th, 2014
12:31 pm
If you use JTF's Tools, you could have value of wave 3th-Elliott Of HPQ
1-Elliott value: 26
2-Elliott value: 21.26
Then, you hit button "Submit", you will see
Value of 3-Elliott Wave is: 27.81068
And extension Value of 3-Elliott Wave is: 30.74
Hence, Value of 3-Elliott Wave is in range [27.81068,30.74]
In fact, It is going up to 34
Read More...
1-Elliott value: 26
2-Elliott value: 21.26
Then, you hit button "Submit", you will see
Value of 3-Elliott Wave is: 27.81068
And extension Value of 3-Elliott Wave is: 30.74
Hence, Value of 3-Elliott Wave is in range [27.81068,30.74]
In fact, It is going up to 34
Read More...